recent umich school of information masters graduate | ux & data specialist for hire
Child-Directed Speech Qualtrics Experiment
SEP 2016 - MAY 2017

Overview
In my time as a cognitive scientist, I designed and implemented both the function and interfaces of all my experiments. I adapted some interfaces in JavaScript but I also became very familiar with Qualtrics software and leveraged it to create experimental interfaces that were both intuitive for participants to use and generated the structure and data output I needed for my experimental design. This is one example of that work, where I was testing how a talker's prosody (tone of voice) can generate expectations about upcoming word forms in real time based on perceived aspects of their addressee's social identy.
Experimental Goals
For context, there's a burgeoning body of work in cognitive science and linguistic fields that seeks to understand how human brains leverage "variation" in speech signals to learn about who's talking and the greater context of the signal at hand. In other words, there's a lot of social context that goes into how every human utterance comes out. For example, everyone sounds different; your voice and pronunciation help others recognize who you are. At the same time, aspects of your social identity like gender, age, and where you grew up have an effect on your speech; and people with social group memberships in common tend to carry similarities in their speech. We're subconsciously aware of these similarities as listeners as well as talkers. On top of that, we change the way we talk depending on who we're talking to. But there isn't much research currently on how this is processed or leveraged in the cognitive science literature. This was a pilot study to confirm that people really generate expectations about the register of a word based on the register of the prosody (tone) of a sentence.
The pilots confirmed this relatively uncontroversial hypothesis and provided a methodological framework for future related experiments to ask more interesting questions about human language processing. In the context of the experiment, the data showed that if someone speaks a sentence in a tone of voice that people usually use with children, people are more likely to predict that the person will end the sentence with a word that is more likely to be used when addressing a child. For example, when they heard the phrase "Let's go to the park and walk the..." in a singsong exaggerated tone and are presented a picture of a dog, they are more likely to choose the word "doggy" to finish the sentance than the word "dog". And in the same scenario where the talker is less exaggerated, as if addressing an adult, people are more likely to choose the "dog" option.
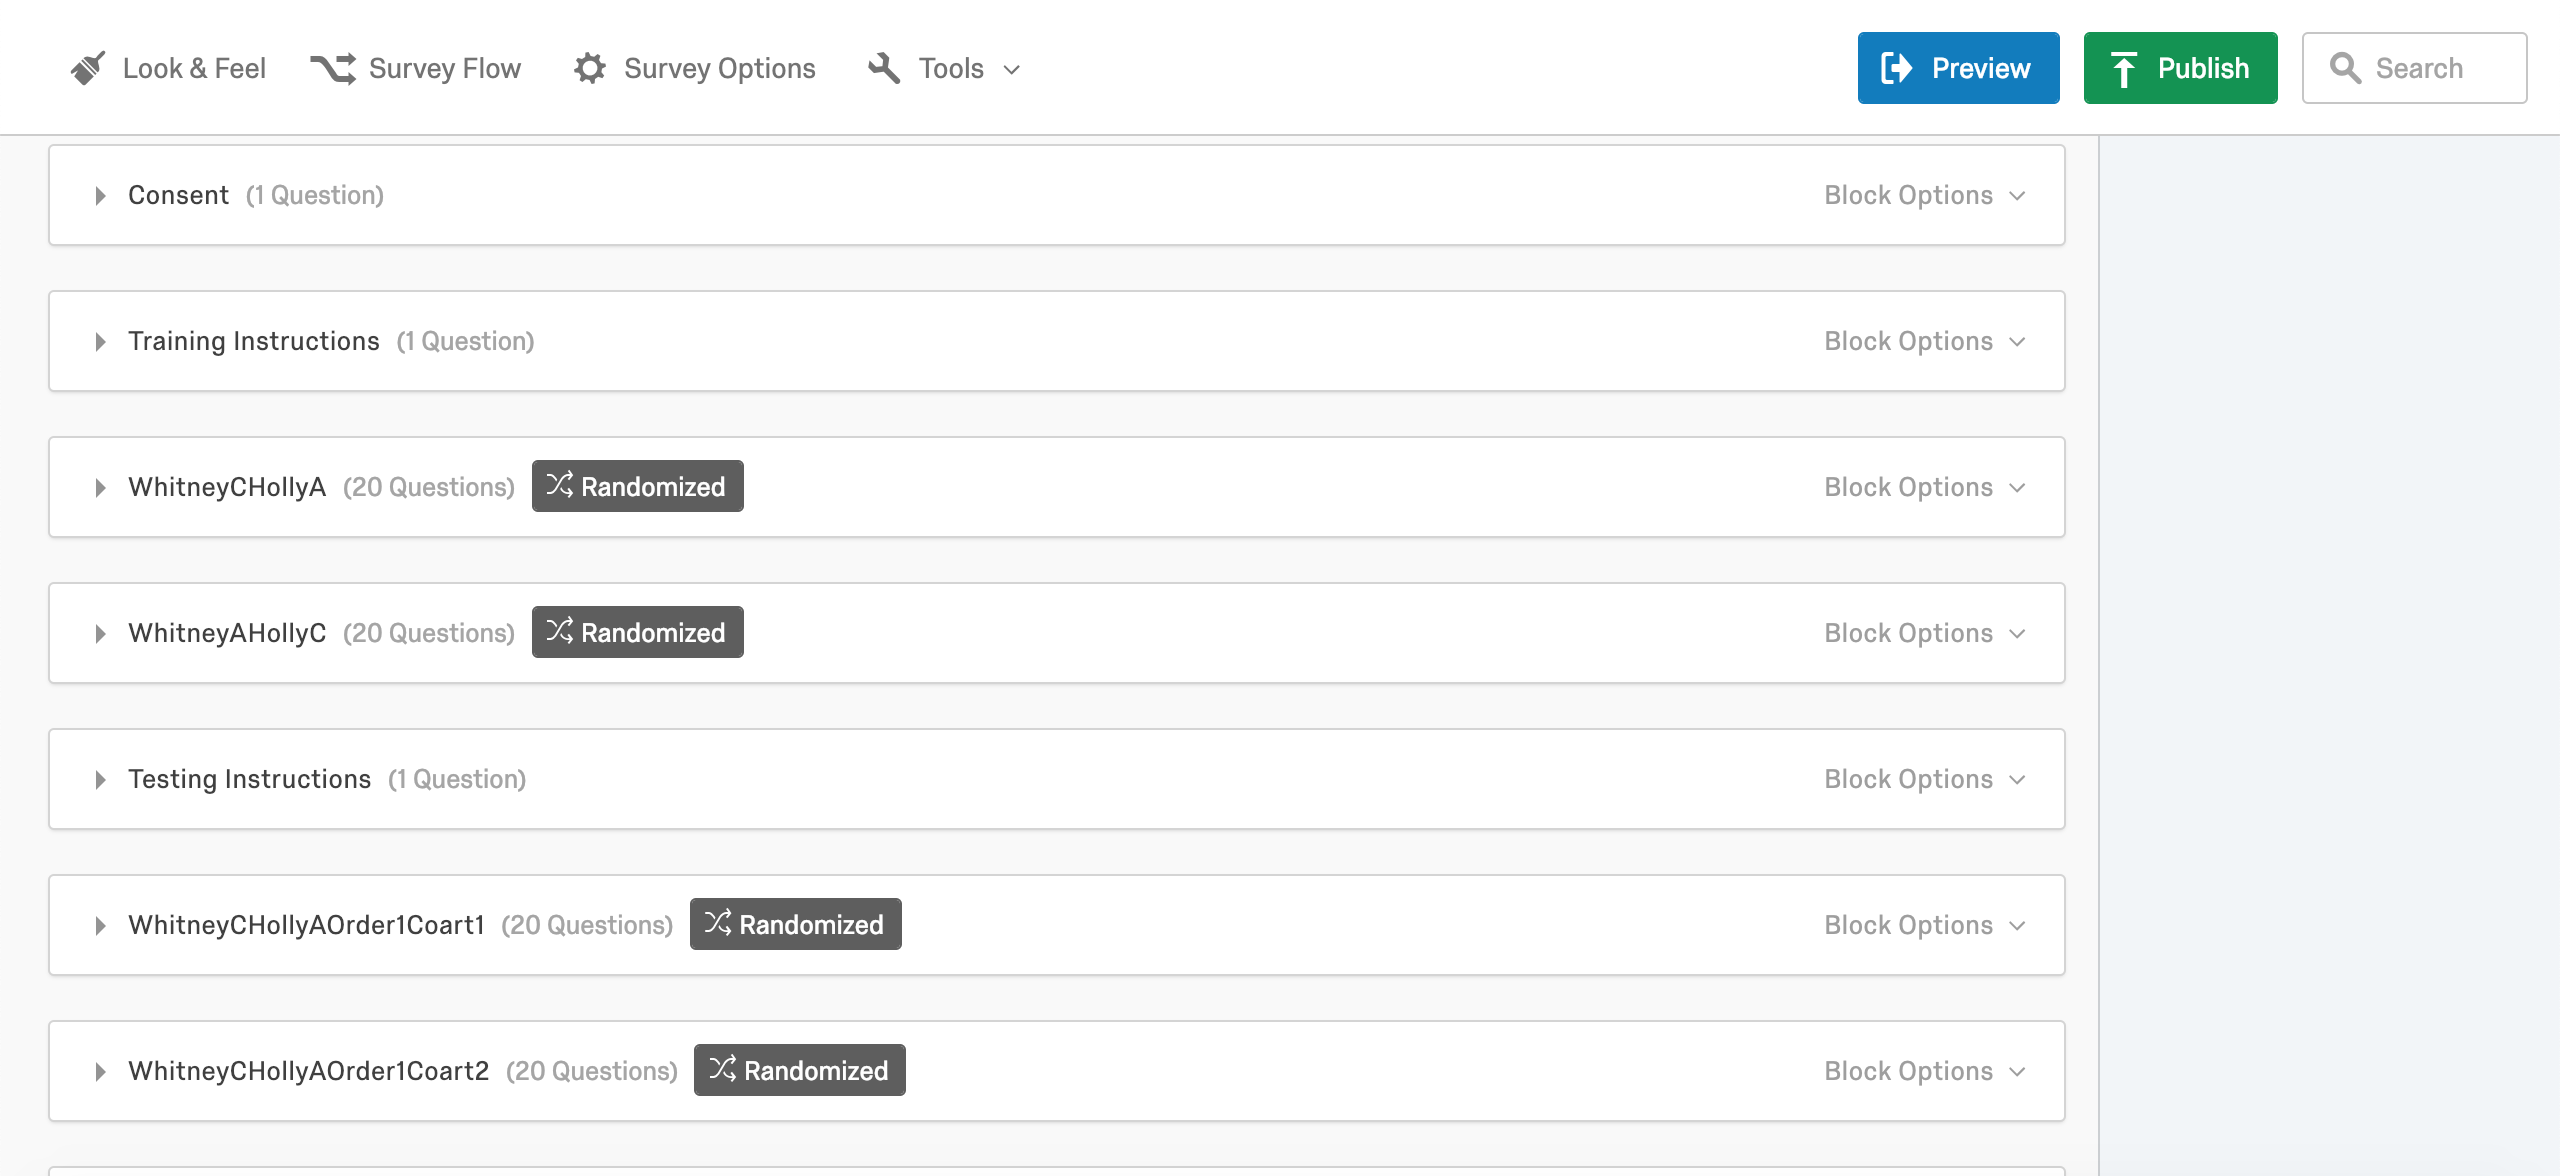
Qualtrics Interface
I designed the pilot's interface using Qualtrics. The design implements block and question randomization. Multiple choice, text entry, and sliding scale type questions are all used for different purposes. Images and audio are both used on almost all questions, and some customized html was used to force an autoplay capability that was unavailable in the building interface at the time. Since launch and implementation, changes have been made to the Qualtrics building interface that cause an issue with the autoplayed audio (the file plays out of sync on top of itself).
 There are two phases of the experiment: a training phase where participants simply listen to the audio and a testing phase wehre participants "finish" the an incomplete sentence by choosing a word. A distraction task is included in the training phase where participants make a rating about the talker's perceived mood. In the testing phase, there are two choices, one "adult" register and one of the same word in the "child" register (i.e. "dog" and "doggie").
The results were downloaded as .csv files and contrast-coded data from the testing phase was submitted to a two-way mixed-effects logistic regression model in R (lme4). The model included register, speaker identity, and their interaction as fixed effects and by-subject and by- item random intercepts. Data visualizations were generated with ggplot2.
