Step 7: Visualization
Histograms
Boxplots
Bar Graphs
Scatter Plots
Lines & Error
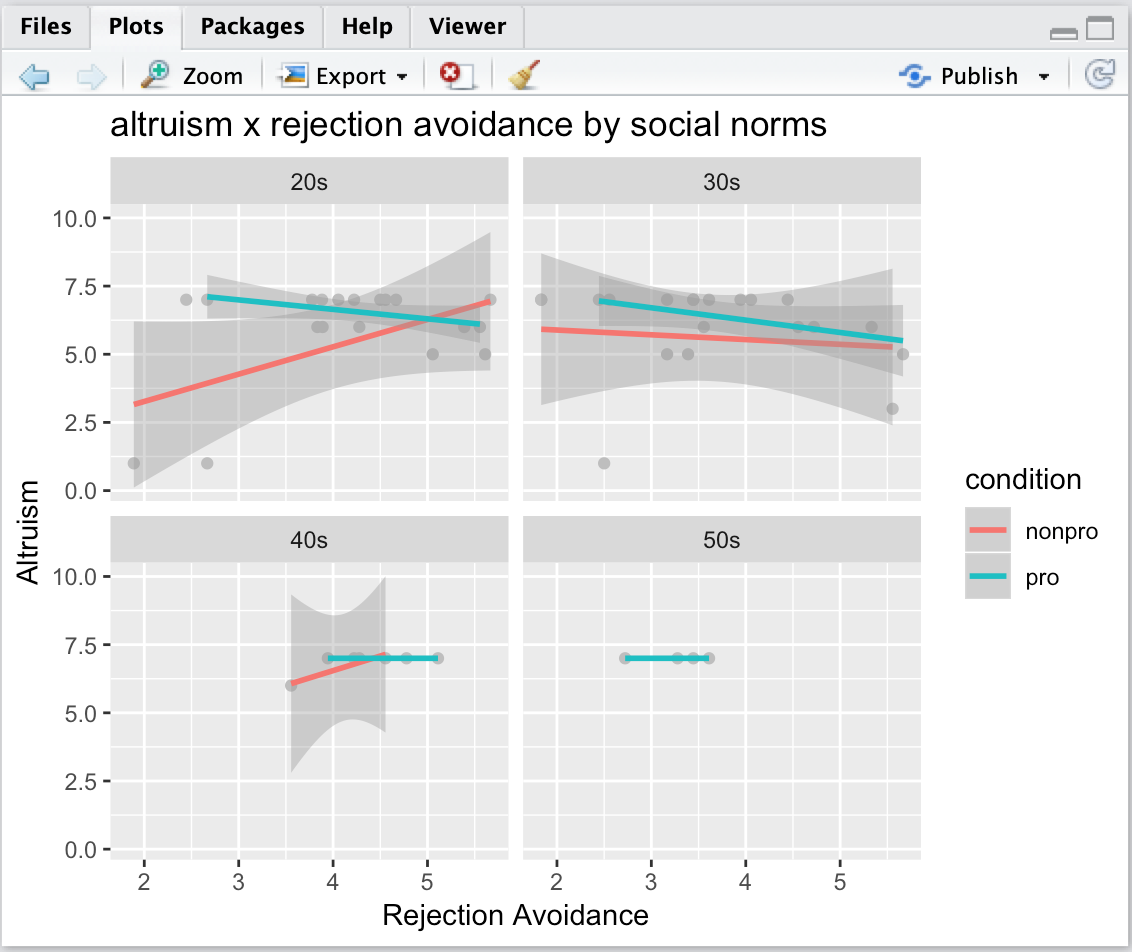
Your plots will show up in the plot window on the bottom left. Keep in mind, you don't have to run your plot code every time you need it; if you generated it before in the same R session, you can scroll back to it using the arrows in the plot window toolbar. You can also export your plots to pdf or png wit the Export dropdown menu in the same toolbar.